↓ Skip to main content

Post Distribution

·104 words

Today I got the idea and I think I’ve seen spectrum plots like these before but I couldn’t quite figure out where. So I dumped all my blogposts and got into Processing to plot it out. It should look something like this but less ugly:
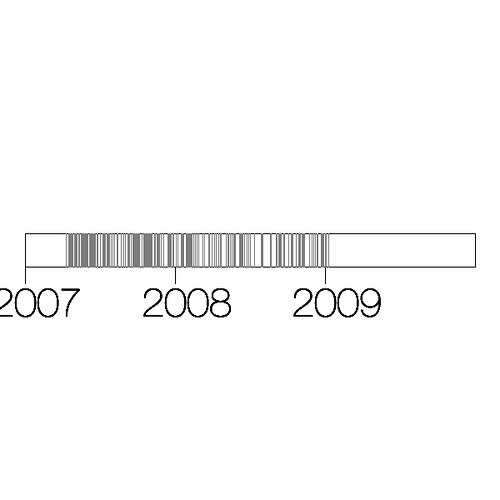
Temporal Distribution of my Blogposts

It clearly shows when I started blogging on this Wordpress in April of 2007 and then how my blogging has become more and more sparse with initially some dense areas and later on some blank ones.

I’ll probably do some iterations on this concept, one with some interaction and another one with blocks aggregated by day of the week.

Alper Cugun
Author
Alper Cugun

Related

Widget distribution and other considerations

·2974 words
I am currently busy doing a project together with Tam Tam where we are tasked with developing a set of five widgets for Dutch government (assigned by the Dutch Ministry of Home Affairs and Kingdom Relations) as a proof of concept of how government data can be used. We’re developing widgets mostly because they are seen as modern, easy to develop and they can be deployed very near to users.